

While technical analysis is often associated with short-term trading, it can also serve as a valuable tool for long-term investors. By understanding key technical indicators and patterns, you can time entries and exits more effectively, identify potential support and resistance zones, and assess market sentiment. Below are the most useful technical tools for long-term investing:
1. Moving Averages
Definition: A moving average (MA) smooths out price data by creating a constantly updated average price over a specific period.
Types of Moving Averages:
- Simple Moving Average (SMA): A straightforward average of closing prices over a given time (e.g., 50-day or 200-day SMA).
- Exponential Moving Average (EMA): Gives more weight to recent prices, making it more responsive to price changes.
How to Use Moving Averages:
- Trend Identification: A rising MA signals an uptrend, while a declining MA indicates a downtrend.
- Golden Cross & Death Cross:
- Golden Cross: When the 50-day MA crosses above the 200-day MA, it suggests a bullish trend.
- Death Cross: When the 50-day MA crosses below the 200-day MA, it signals a bearish trend.
- Support and Resistance: Stocks often “bounce” off key moving averages like the 50-day or 200-day, acting as dynamic support or resistance.
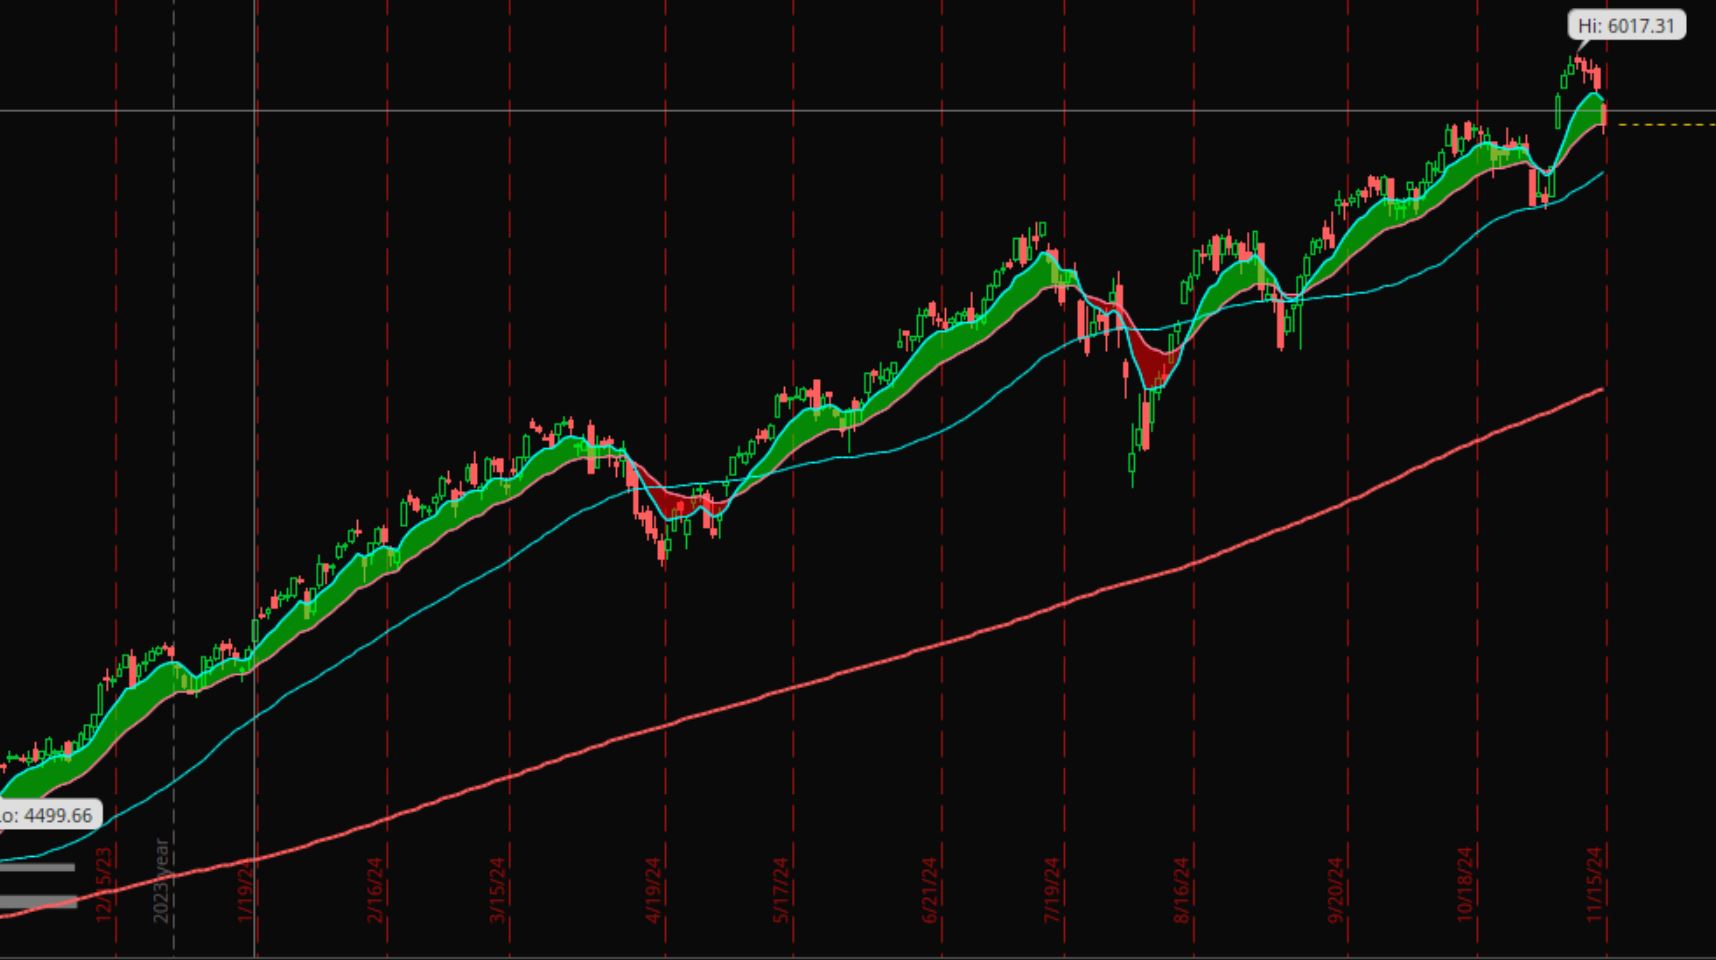
- 8 and 21 EMA for Short-Term Direction:
The 8-period EMA and 21-period EMA are particularly useful for identifying short-term trends and potential entry or exit points. The 8 EMA reacts quickly to price changes, while the 21 EMA provides a slightly slower, more stable trend signal.- Bullish Crossover: When the 8 EMA crosses above the 21 EMA, it signals a potential uptrend. This could be used as a buy signal or an opportunity to enter a long position.
- Bearish Crossover: When the 8 EMA crosses below the 21 EMA, it signals a potential downtrend. This could be used as a sell signal or an opportunity to exit a long position or enter a short position.
- Why It’s Useful for Long-Term Investors: On a weekly chart, the 8 and 21 EMA crossover provides a clearer view of medium-term trends, helping investors align with the market’s direction while avoiding short-term noise.
2. Support and Resistance
Definition: Support levels are areas where the price tends to stop falling due to increased buying pressure. Resistance levels are where prices often stop rising due to selling pressure.
How to Use Support and Resistance:
- Identifying Key Zones: Look for price points where the stock has historically reversed direction multiple times.
- Breakouts and Reversals:
- A breakout above resistance can indicate the start of a new uptrend.
- A break below support may signal further downside.
3. Fibonacci Retracement
Definition: Fibonacci retracement uses key ratios (23.6%, 38.2%, 50%, 61.8%, and 78.6%) to identify potential levels where a stock might reverse during a pullback.
How to Use Fibonacci Retracement:
- Identify Pullback Levels: Apply Fibonacci retracement from a recent high to a recent low (or vice versa) to find potential support or resistance levels.
- Common Uses: The 38.2%, 50%, and 61.8% levels are the most significant. For example, if a stock is in an uptrend, these levels can help you determine where to add to your position during a pullback.
Why Fibonacci Numbers Work:
Fibonacci ratios appear naturally in many phenomena, from seashell patterns to galaxy formations. Investors apply these ratios to price movements, believing markets are influenced by natural patterns and human psychology.
Application:
After a significant price movement, retracement levels help predict areas where the price might stall or reverse.
4. Relative Strength Index (RSI)
Definition: RSI is a momentum oscillator that measures the speed and change of price movements, ranging from 0 to 100.
Key Levels:
- Overbought: Above 70, suggesting the stock might be due for a pullback.
- Oversold: Below 30, indicating the stock might be undervalued or due for a bounce.
How to Use RSI:
Identify Reversals: Use RSI to spot potential trend reversals in overbought or oversold conditions.
Bearish Divergence: Price makes a higher high while RSI makes a lower high, signaling potential downside.
Bullish Divergence: Price makes a lower low while RSI makes a higher low, signaling potential upside.
5. Volume Profile (Advanced Tool)
Definition: Volume profile shows the distribution of trading activity over a specific price range, rather than time. It helps identify price levels with high trading interest (called “high-volume nodes”) and areas of low interest (“low-volume nodes”).
Key Components of Volume Profile:
- Point of Control (POC):
The POC is the price level with the highest trading volume within a specified period. It represents the price where the most trading activity occurred, making it a critical level for understanding market sentiment.- How to Use POC:
- The POC often acts as a strong support or resistance level. If the price is above the POC, it may act as support; if below, it may act as resistance.
- A break above or below the POC can signal a shift in market sentiment and potential continuation of the trend.
- How to Use POC:
- 70% Volume Distribution:
The 70% volume distribution represents the price range where 70% of the total trading volume occurred. This range is bounded by the Value Area High (VAH) and Value Area Low (VAL).- How to Use 70% Distribution:
- The 70% range is considered the “fair value” area, where most trading activity took place. Prices tend to revert to this range after moving outside of it.
- If the price is trading within the 70% range, it suggests consolidation or balance. A breakout above the VAH or below the VAL can indicate a new trend or momentum shift.
- How to Use 70% Distribution:
How to Use Volume Profile:
- Support and Resistance:
High-volume nodes, including the POC and the 70% distribution range, often act as strong support or resistance zones. These levels are where buyers and sellers have shown significant interest, making them key areas to watch for price reactions. - Trend Confirmation:
Volume spikes at key price levels confirm the strength of a trend or breakout. For example, if the price breaks above the VAH with high volume, it suggests strong buying interest and a potential continuation of the uptrend. - Reversal Signals:
A lack of volume in certain areas (low-volume nodes) may indicate weaker price levels and potential reversals. If the price moves into a low-volume area, it often struggles to sustain momentum and may reverse back toward the high-volume nodes. - Fair Value and Imbalance:
- When the price is within the 70% distribution range, it suggests the market is in balance, and traders are comfortable with the current price levels.
- When the price moves outside the 70% range, it indicates an imbalance, often leading to a reversion back to the fair value area or a continuation of the trend if accompanied by high volume.
Practical Application:
- For Long-Term Investors: Use the POC and 70% distribution to identify key levels for adding to positions during pullbacks or scaling out during rallies.
- For Entry and Exit Points: Look for price reactions at the POC, VAH, or VAL to time entries or exits. A bounce off the POC or VAL could signal a buying opportunity, while a rejection at the VAH might indicate a selling opportunity.
- For Trend Confirmation: Combine volume profile analysis with other tools like moving averages or RSI to confirm trends and avoid false breakouts.
By incorporating the 70% distribution and Point of Control (POC) into your volume profile analysis, you gain a more nuanced understanding of market dynamics. These tools help you identify fair value areas, key support and resistance levels, and potential reversal points, making volume profile an even more powerful tool for long-term investors and traders alike.
Conclusion: Technical Analysis for Long-Term Investors
While technical tools can refine your investing strategy, they are not standalone solutions. Always use them alongside fundamental analysis and broader market research. Moreover, when entering a position, avoid buying all at once. Instead, adopt a block-buying strategy: divide your investment into smaller portions and purchase over time. This approach reduces the risk of poorly timed entries and takes advantage of market fluctuations.
By combining technical insights—such as moving averages, support and resistance, Fibonacci retracement, RSI, and volume profile—with a disciplined buying approach, long-term investors can improve their decision-making and enhance their portfolio’s resilience. The addition of short-term tools like the 8 and 21 EMA crossover further refines your ability to time entries and exits, making your strategy more dynamic and adaptable to changing market conditions.


Leave a Reply