
By now, you know how to find great businesses, build a resilient portfolio, and master the emotional side of investing.
But there’s one more tool worth learning — basic technical analysis.
Not to time the market.
Not to day trade.
But to improve your entry and exit decisions.
Even long-term investors can benefit from a few simple chart-based tools.
🤔 What Is Technical Analysis?
Technical analysis is the study of price charts and patterns. It doesn’t tell you what to buy — that’s what fundamentals are for — but it can help you decide when to buy or sell.
For long-term investors, the goal is not prediction.
The goal is probability and patience — waiting for favorable setups and avoiding emotionally driven decisions.
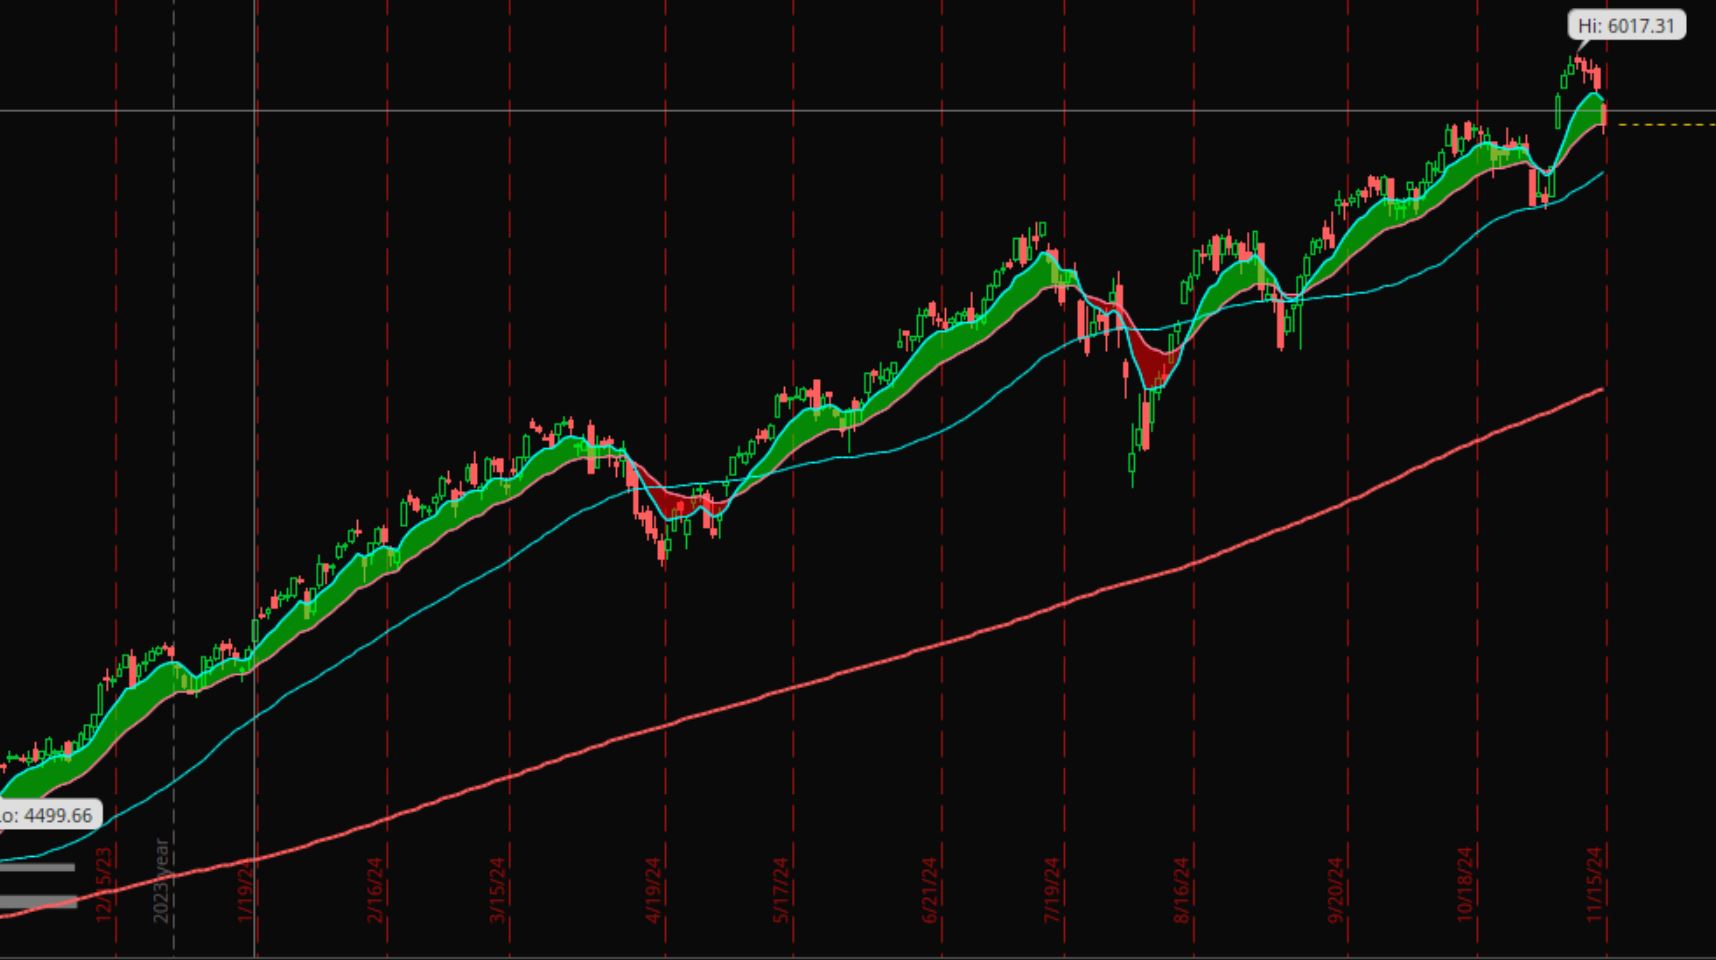
📉 Moving Averages — Spotting the Trend
What it is: A moving average smooths out price data over time, helping you see the trend, not the noise.
- 50-day moving average (50DMA): Short-term trend
- 200-day moving average (200DMA): Long-term trend
- OR
- 8-week moving average(equivalent to 40-day moving average)
- 21 week moving average(equivalent to 105-day moving average)
- 55-week moving average(equivalent to 275-day moving average)
📌 How to use it:
- If the price is above the 200DMA → trend is strong
- If the price is below the 200DMA → trend may be weakening
- If the 50DMA crosses above the 200DMA → called a golden cross (bullish signal)
- If the 50DMA crosses below the 200DMA → called a death cross (bearish signal)
✅ Use it to confirm trend direction before buying a dip.
📏 Support & Resistance — Where Buyers and Sellers React
What it is: These are price levels where stocks tend to reverse or pause. Support acts like a floor. Resistance acts like a ceiling.
📌 How to use it:
- Support: If a stock bounces off a certain level multiple times, that price is support.
- Resistance: If a stock struggles to break above a level, that’s resistance.
✅ Look for entry near support zones, especially if fundamentals are strong.
⚠️ If support breaks with high volume, price may drop further.
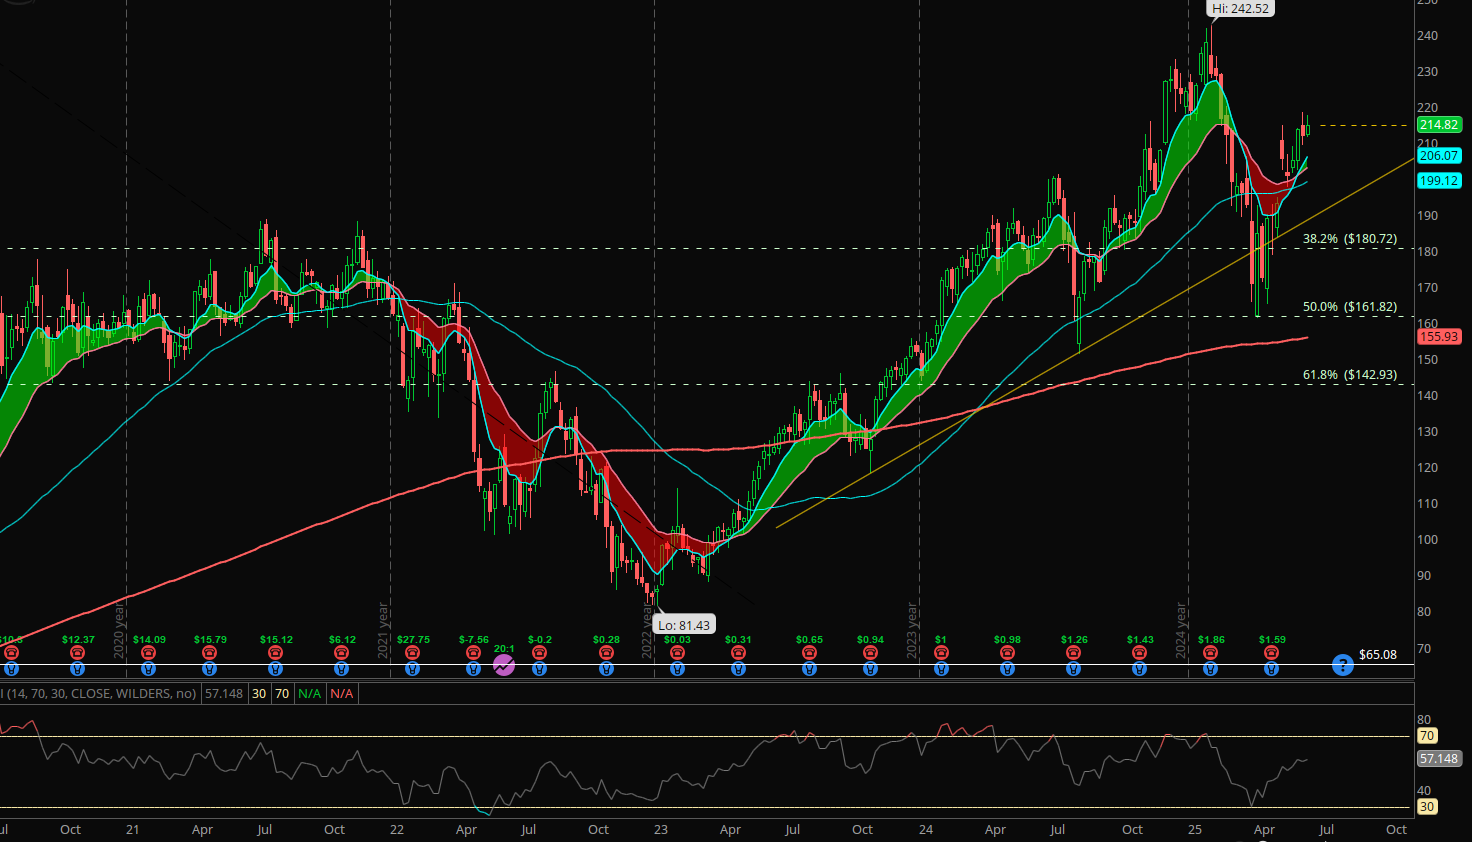
🌀 Fibonacci Retracement — Spotting Pullbacks in an Uptrend
What it is: Fibonacci retracement levels are based on key ratios (like 61.8%, 50%, and 38.2%) that identify potential pullback zones.
📌 How to use it:
- In a strong uptrend, draw a line from recent low to recent high.
- The 38.2% to 61.8% levels often act as reversal zones — places where the stock may resume its upward move.
✅ Wait for price to retrace into this zone before adding to a position.
This is a tool — not a guarantee. Use it with other signals for best results.
📉 RSI (Relative Strength Index) — Measuring Momentum
What it is: RSI measures whether a stock is overbought or oversold, on a scale of 0–100.
- RSI > 70 → Possibly overbought
- RSI < 30 → Possibly oversold
📌 How to use it:
- When RSI drops below 30 in a quality company → watch for signs of reversal
- RSI divergence (e.g. RSI going up while price is still falling) can signal a trend change coming
✅ RSI can give you the emotional temperature of the market — is it too greedy or too fearful?
🕰️ Timeframes Matter — Think Long-Term
Technical analysis works across many timeframes — from 1-minute charts to 20-year trends.
But as a long-term investor, you need to base decisions on the big picture — not day-to-day swings.
📌 How to use timeframes:
- Monthly Chart (20+ years) → Best for understanding the long-term trend and secular cycles
- Weekly Chart (3–5 years) → Ideal for spotting multi-year setups, major reversals, or trend confirmations
- Daily Chart (1 year) → Useful for short-term context or precision entries — but don’t overweigh it
✅ Always zoom out first.
Check all timeframes if you like, but base your decisions on weekly or monthly charts, where patterns are stronger and noise is filtered out.
“The longer the timeframe, the more meaningful the trend.”
🧠 Putting It All Together (Start with Intrinsic Value)
Let’s say you’ve found a great company — strong business model, durable moat, excellent fundamentals.
But before you look at any chart…
✅ Step 1: Check the Intrinsic Value
Use your valuation method (like a DCF) to estimate what the business is truly worth.
- If the current price is above fair value → wait. Be patient.
- If the price is below or nearing fair value → now’s the time to zoom in on the chart.
✅ Step 2: Use Technicals to Spot Entry Zones
Once the stock is trading near or under its fair value, check for:
- 200-day moving average – Is it above or below? What’s the trend?
- Support levels – Are we near a strong base or bounce zone?
- Fibonacci retracement zones – Are we in the 38–61% pullback range?
- RSI signals – Is it oversold or showing a reversal setup?
This combo helps you recognize ideal buy zones before the opportunity hits — and gives you the confidence to act when it does.
“Valuation tells you what to buy.
Technicals help you decide when to buy.”
🛠️ Tools You Can Use
You don’t need a Bloomberg Terminal. These free platforms work great:
- Think or Swim by Schwab– the best charting software; need to have a Schwab brokerage account.
- TradingView – Excellent charts, even on the free plan
- Finviz – Heatmaps, RSI, MA screens
💡 Summary: Technical Analysis for Long-Term Investors
- Technicals don’t replace fundamentals — they complement them
- Moving averages show trend strength
- Support/resistance show crowd psychology
- Fibonacci and RSI help time your entries
- Use monthly and weekly charts for decisions — not daily noise
🔑 Key Takeaway
Technical analysis is like reading the mood of the market.
When combined with strong fundamentals, it gives you the confidence to act — and the patience to wait.
Use the chart not to chase price… but to buy wisely and hold confidently.


Leave a Reply